Main Street Metrics Dashboards
Turn Data into Action for Your Main Street
Main Street Metrics is more than a dashboard - it’s a complete system designed to help communities understand performance, respond to change, and take action with confidence.
By combining real-time data, expert insights, and ongoing support, Main Street Metrics transforms complex information into clear, actionable direction - so you can strengthen your local economy, support businesses, and drive measurable impact.

Why Data Matters
Main streets are constantly evolving, but most communities lack consistent, up-to-date data to guide decisions. Main Street Metrics fills that gap by giving you:
- A clear picture of who is visiting, when, and from where.
- Insight into spending, media usage, visitor interests, business health, and local trends.
- The ability to measure impact and adjust in real time.

The Main Street Metrics Package
What You Can Track
Main Street Metrics brings together thousands of data sources to give you a complete, real-time picture of your main street.
Core Metrics include:
- Foot Traffic Trends – Daily and seasonal visitor patterns
- Visitor Types – Residents, workers, tourists
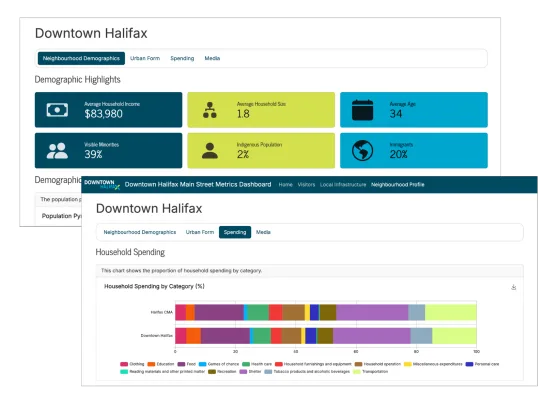
- Demographics – Age, income, household type, ethnicity, with projections
- Business Mix – Independent vs. chain, openings/closings, risk profiles
- Consumer Behaviour – Spending patterns and lifestyle segmentation
- Civic Assets – Infrastructure, transit, and public amenities

What Powers Your Dashboard
- Weekly visitor patterns for the past four years by time of day and day of week.
- Visitor origins and trade areas
- Consumer psychographics and lifestyle segmentation.
- Detailed demographic and consumer segmentation.
- Media behaviours and preferences.
- Consumer spending trends and categories.
- Business mix, health, employment and change over time.
- Civic and service infrastructure.
- Housing and urban form.
From Tracking Data to Using It For Your Community
Target marketing and tourism efforts
Refine events and activations
Identify retail gaps and investment opportunities
Support funding applications and advocacy
Measure the impact of construction, policy, and external changes
Discover the Dashboards
Track what matters along main street. Standardized metrics benchmark civic assets, business mix, and demographics—making it easy to compare across communities, measure strengths, and spot gaps. Use it to assess how main street supports the local economy, daily life, and community vitality.
Visitor Tracking
Our dashboards show real-time foot traffic on your main street—who is visiting, when they arrive, how far they come from, and how often. Get highlights of patterns in activity that reveal tourism appeal, retail opportunity, and the overall pulse of your street.
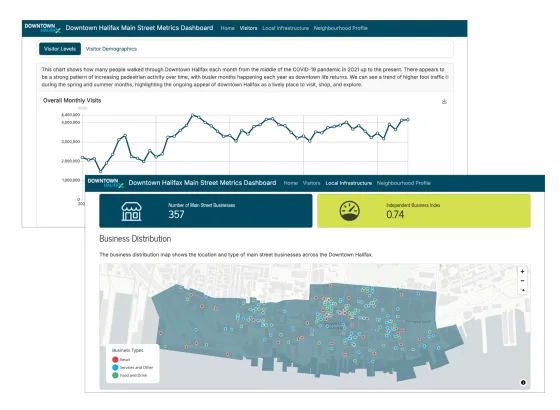
Business & Spending Insights
An interactive map and chart showing what kinds of businesses are on your main street, and how visitors are spending. In your toolkit, these insights support local economic development and success.
Dashboard Packages
Choose the level of insight that fits your community.
| Package | Cost | About | Best For |
|---|---|---|---|
| Standard | $10,000 | Everything you need to get started—fast. Includes monthly updates and access to a full suite of core datasets covering foot traffic, visitor profiles, spending patterns, and business activity. | Communities looking to make smarter decisions, improve programming, and strengthen advocacy with data. |
| Custom | $15,000 -$40,000 | Built around your community. Includes everything in Standard, plus custom data integration and tailored analysis using local and open datasets. | Communities ready to go deeper—aligning data with local priorities and driving targeted investment and growth. |
Discounts available for associations, regions, and multi-community bundles.

Ready to Strengthen Your Main Street?
Book a demo or connect with our team to see how Main Street Metrics can support your community at cui@canurb.org , or download the Main Street Metrics Dashboards information sheet.